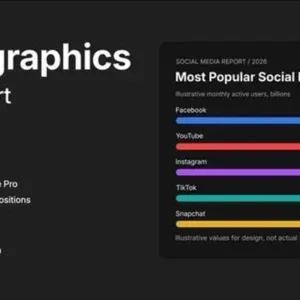
By installing Adobe Premiere Pro, you can easily edit this project to match your needs and use it in any language.
85 MB
ZIP
Pr-Pro
Original
Khalaj.Net
Works out of the box—no extra plugins needed.
Full HD for modern screens and platforms.
Step-by-step guide to help customize easily.
text, media, timing, and layout with full control.
This collection of animated bar charts and infographics is designed for clear, modern data presentation.
It includes standard bar graphs, waterfall charts, stacked distributions, and comparative layouts, giving you versatile options to visualize complex statistics in a visually compelling way. The charts feature a sleek, dark background with vibrant bars and smooth, minimalist animations that emphasize clarity and ease of understanding. Ideal for social media reports, corporate meetings, financial summaries, or academic research, these modular charts let you select the exact types you need for each scene.
The cohesive design ensures a polished, professional look throughout your entire video, making your data stand out and your message clear. Compatible with Premiere Pro, the project is structured for quick and flexible editing. Integrate the charts seamlessly into your workflow and update them rapidly, even without advanced technical skills. This tool is perfect for transforming raw data into engaging visual stories that captivate and inform your audience.