By installing Adobe Premiere Pro, you can easily edit this project to match your needs and use it in any language.
1.86 MB
ZIP
Pr-Pro
Original
Khalaj.Net
Works out of the box—no extra plugins needed.
Full HD for modern screens and platforms.
Step-by-step guide to help customize easily.
text, media, timing, and layout with full control.
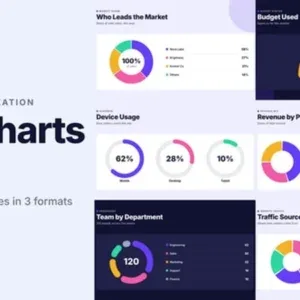
This toolkit features animated flat pie charts, multi-layered donut rings, and semi-circular progress bars, all designed with a clean, minimalist aesthetic and vibrant colors. Each of the ten animated scenes brings your data to life with smooth transitions, dynamic segment growth, and real-time counting numbers, making complex information easy to understand. All values and labels are fully customizable, allowing you to tailor each chart to your specific project needs.
The minimalist layout ensures your data remains the focus, while the color palette provides clear distinction between different data sets. Whether you need to present market share, budget allocations, or user demographics, these graphics offer a sleek and engaging solution. This asset is ideal for corporate presentations, financial reports, and marketing explainers. You can seamlessly integrate these animated charts into business videos to illustrate revenue growth, team performance, or comparative statistics.
The real-time animation and editable elements help you communicate insights clearly and professionally. Compatible with Adobe Premiere Pro, this project includes ten ready-to-use animated scenes. The toolkit is designed for quick customization and smooth workflow, making it a practical choice for any business or creative project requiring effective data visualization.