By installing Adobe Premiere Pro, you can easily edit this project to match your needs and use it in any language.
10.4 MB
ZIP
Pr-Pro
Original
Khalaj.Net
Works out of the box—no extra plugins needed.
Full HD for modern screens and platforms.
Step-by-step guide to help customize easily.
text, media, timing, and layout with full control.
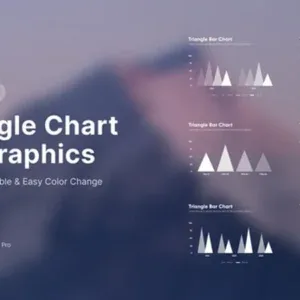
This asset features a sophisticated set of nine triangle-based infographic charts designed for clear and impactful data visualization in Premiere Pro. Each chart animates dynamically, with triangles growing to represent values and synchronized ticking numbers, creating a modern and professional look for any presentation. The visual style is strictly minimalist, using generous negative space to keep the focus on your statistics.
All nine elements share a consistent design language, making them easy to integrate into a wide range of presentation formats without disrupting visual harmony. Users can easily customize both the colors and the numerical values to match their branding or specific data requirements.
These charts are ideal for corporate reports, financial summaries, analytical business presentations, and even broadcast graphics, offering a visually engaging alternative to standard bar charts. This template is fully compatible with Premiere Pro, requires no additional plugins, and operates at 29.97 fps. The download includes. mogrt and PDF files for straightforward workflow integration. The geometric approach provides a unique visual hierarchy, making complex datasets easier to understand and present.