By installing Adobe Premiere Pro, you can easily edit this project to match your needs and use it in any language.
202 MB
ZIP
Pr-Pro
Original
Khalaj.Net
Works out of the box—no extra plugins needed.
Full HD for modern screens and platforms.
Step-by-step guide to help customize easily.
text, media, timing, and layout with full control.
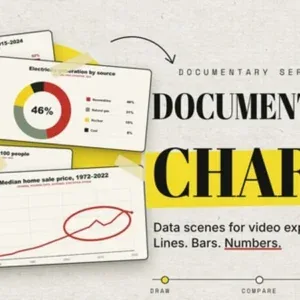
This asset delivers a collection of animated data charts and tables designed with a documentary and editorial aesthetic. The tactile paper texture background, realistic tape accents, and hand-drawn red annotations create a sense of authenticity and attention to detail. Each chart is crafted for clarity and modern appeal, ensuring that information is presented in a visually engaging and professional manner. The toolkit includes animated line graphs, vertical and horizontal bar charts, pie charts, scatter plots, and clean data tables.
Smooth motion graphics and a refined color palette keep the focus on the data, making complex statistics and findings easy to follow. The hand-drawn annotation style guides the viewer’s eye to key insights without overwhelming the presentation. This collection is ideal for presenting research findings, financial reports, or statistical data in broadcast news, educational videos, or business presentations. The editorial design ensures a cohesive and sophisticated look, helping to communicate numerical information with clarity and impact.
It is especially suited for projects that require a narrative approach to data visualization. Compatible with Premiere Pro, this asset offers a range of ready-to-use animated charts and tables. Integration into documentary, news, or educational workflows is straightforward, requiring no advanced technical skills.