By installing Adobe Premiere Pro, you can easily edit this project to match your needs and use it in any language.
41.6 MB
ZIP
Pr-Pro
Original
Khalaj.Net
Works out of the box—no extra plugins needed.
Full HD for modern screens and platforms.
Step-by-step guide to help customize easily.
text, media, timing, and layout with full control.
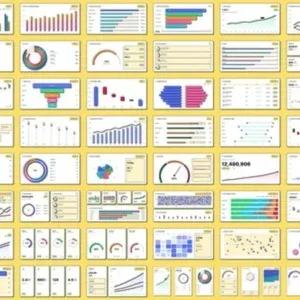
This collection features a wide range of animated CSV data charts in a striking neobrutalist style, including bar charts, line graphs, area charts, donut and pie diagrams, radar charts, and heatmap calendars. Each chart is crafted to give your data presentations a bold, modern look that captures audience attention in any information-rich context. The animations are smooth and refined, with easy controls for customizing colors and adjusting animation speed.
This flexibility allows you to match the charts to your brand identity or project needs. The neobrutalist design adds a contemporary edge, making these charts ideal for projects that demand a strong visual presence. Perfect for professional annual reports, market analysis presentations, and engaging social media infographics, these charts support both standard 16: 9 and vertical 9: 16 formats.
This ensures seamless integration into broadcast video or mobile content, giving you the freedom to present data across multiple platforms. Compatible with Premiere Pro, the template offers intuitive controls for color and animation speed, requiring no advanced technical skills. This set is a modern solution for presenting complex data with clarity and visual impact.