By installing After Effects software, you can edit this project as you wish and in any language.
0.95 MB
ZIP
AE-CC
Original
Khalaj.Net
Works out of the box—no extra plugins needed.
Full HD for modern screens and platforms.
Step-by-step guide to help customize easily.
text, media, timing, and layout with full control.
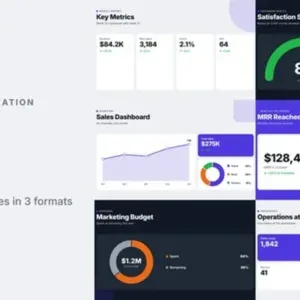
This asset delivers a comprehensive suite of flat KPI data visualization tools designed for clear and engaging business communication. The project features animated bar charts for revenue growth, line graphs for user trends, and circular gauges for satisfaction scores. Each element is crafted in a clean, minimalist style to ensure data is easy to read and understand. Smooth, purposeful animations and well-organized layouts help make complex information accessible to any audience.
The flat design brings a modern, professional look to presentations, keeping the focus on key numbers and results without unnecessary distractions. Perfect for marketing reports, financial reviews, and sales dashboards, this set is also suitable for business updates on social media. The variety of charts and gauges allows creators to select the best visual for their specific data story. No editing of elements or colors is required, as all components come pre-arranged and ready for use.
The project integrates seamlessly into business presentations or explainer videos, saving time and ensuring a polished display of KPI data.