By installing After Effects software, you can edit this project as you wish and in any language.
84.2 MB
ZIP
AE-CC
Original
Khalaj.Net
Works out of the box—no extra plugins needed.
Full HD for modern screens and platforms.
Step-by-step guide to help customize easily.
text, media, timing, and layout with full control.
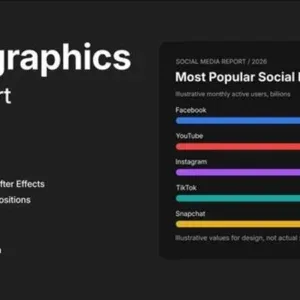
This set features 12 unique animated bar chart infographics designed for clear and impactful data visualization. The collection includes standard horizontal bars, stacked bars, waterfall charts, and range distributions, all styled with a modern dark background and vibrant color-coded data segments for maximum clarity. The animations are smooth and sophisticated, ensuring that your audience remains focused on the data itself.
The dark theme provides a professional look and enhances the visibility of key statistics, making these charts ideal for business presentations, financial reports, social media analytics, and project timelines. These animated charts are perfect for corporate reporting, summarizing financial data, visualizing social media metrics, or illustrating project progress. The toolkit offers flexibility for presenting complex information in a visually engaging and accessible way, helping you communicate insights effectively. Compatible with After Effects CC, this asset requires no additional plugins.
Each composition runs up to 60 seconds at 30 fps, and files are provided in aep, gif, html, mp4, and pdf formats. Integration into digital presentations and video projects is straightforward and efficient.